A day late and a few thousand riders short
Earlier today, Project Connect released a methodology memo (PDF version) providing an overview of their approach to estimating ridership. The memo raises three major concerns, which I describe below.
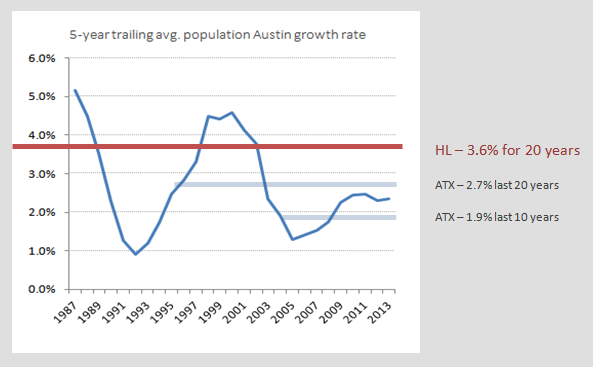
1. Ridership estimates use population growth assumptions unbound from empirical reality
The Project Connect team continues to based on where our planning would politically prefer growth happen instead of where growth empirically happens. An excerpt from the memo follows:
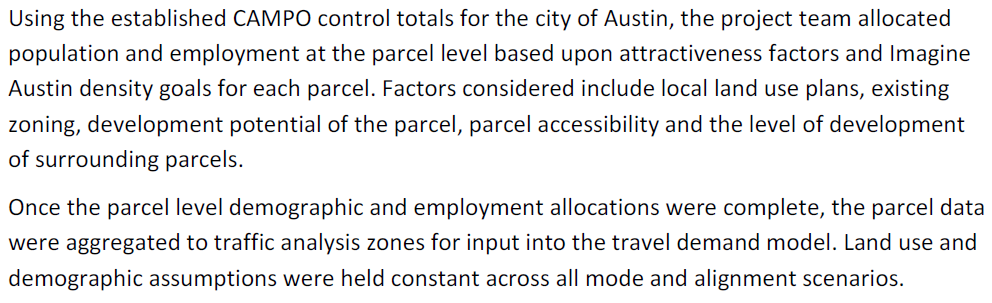 We do not know if the team's parcel attractiveness approach actually predicts observed growth. Proponents of this route have faith that rail can "shape" growth, but that is a concept with only anecdotes and ideology to support it. If the model was validated, Project Connect would have released an analysis of the model's past accuracy in estimating parcel changes between 1990 and 2010 and/or 2000 and 2010. I suspect that such a validation will not be undertaken because it would prove there's no meaningful contribution from the parcel attributes chosen by the modeling team that would satisfy the unrealistic projected growth for Highland.
2. The methodology triple counts 'special' markets
The actual forecast daily ridership for 2030 is not the much publicly discussed 18,000 figure but 15,580. To boost this total, the methodology arbitrarily tacks on 25 days to the standard FTA 300 day weekday and weekend service plan (why not 20 days or 30 days?). The reasoning is the special markets served (i.e. special events). This boosts the annual ridership from 4.674 million to 5.06 million.
A second events boost is tacked on based on observed higher uses of MetroRail, which gets annual ridership to 5.20 million or 16,000 daily riders. It's not clear why those wouldn't be included in the rationale for the boost from 300 to 325. Finally, the document indicates that the consultants believe an additional 2,000 riders are not being captured from ACC and the medical district (why not 1,000 or 3,000?). Obviously the demographic allocation tool is modeling population and employment growth in those areas.
And that's how we get to 18,000. The use of the lower daily ridership estimate worsens the productivity of an already suspect route; understandably, proponents would prefer to avoid that number. We all should probably stop citing the 18,000 figure and stick to the actual model result: 15,580.
3. The medical school is not a major ridership source
Much of the public discourse about the advantages of this route are tied to unleashing an innovation district around the medical school. The daily boardings (both south- and northbound) at the medical school are estimated at 860 in 2030. That's 6% of the 15,580 daily ridership. This reaffirms the importance of evaluating the service as a mobility investment to the many other already-existing employment destinations downtown. I am excited about an innovation district, but at this time, it seems serving it with high frequency bus or Bus Rapid Transit is a better use of scarce transit dollars.