Transit, Turnout, and Trust
Is the Red Line Circulator (a.k.a the “Mueller” route) the only politically feasible initial urban rail sequence? Some proponents of the preliminary urban rail route generated by the Project Connect process imply this is the case.
To evaluate this we have to revisit the failed 2000 rail referendum. Its specter haunts transit politics discussions and is the key piece of publicly-available evidence in rail political feasibility debates.
In that election, there were 124,479 votes cast for rail and 126,434 against. The narrow 1,955 loss margin means that if just 979 ‘no’ votes changed to ‘yes’ then the proposition would have passed.
In 2000 George W. Bush won Travis County with 46.40% of the vote against Gore’s 41.42%. In 2012, Barack Obama won with 60.14%. However, let’s assume (as many smart Austin politicos seem to do) that local rail politics are roughly the same as 13 years ago because of something inherent (enigmatic?) about transit politics in Austin.
The three basic strategies for changing the failed 2000 referendum outcome are: (1) persuade ‘against’ votes so that they vote ‘yes’ or skip the item, (2) boost turnout amongst supportive constituencies, and (3) a combination of the first two. So how can we ‘build a winning map’ and what does it tell us about a given rail route’s political feasibility?
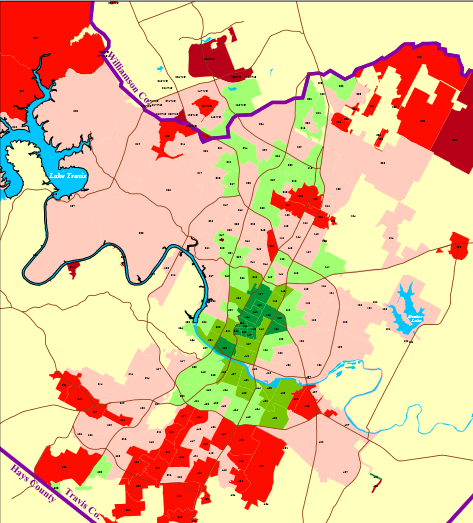
Here’s the Austin geographic vote distribution from the 2000 rail referendum courtesy of the City Demographer Ryan Robinson (cherry red precincts voted 'for' between 30% and 40%):
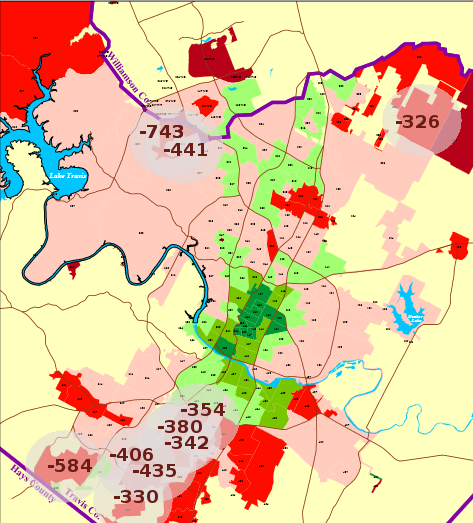
The Robinson visualization focuses on vote proportions; but to get a better sense of where the damage was done, let’s examine vote count margin. Proportions obscure that some districts have more registered voters, as well as differing rates of turnout for those voters.
The top ten ‘against’ precincts and their count are visualized below:
What both the original Robinson visualization and my vote count version highlight is that the 2000 referendum was lost – geographically, at least - in South Austin. It’s certainly possible that the election was actually lost by some demographic segment that is over-represented in South Austin. Independent men and Democratic-leaning women that don’t use transit have been mentioned to me. Perhaps these groups disproportionately resided in South Austin then.
But there’s no public polls that I could find that would allow for verification of a demographic segment explanation for 2000. More importantly, in contemporary rail politics, the political feasibility argument is often geographic. “You can’t get the neighborhoods you need” behind proposal X or Y is a familiar admonishment. So any route proposal seeking to persuade ‘against’ voters needs to deal with the South Austin issue.
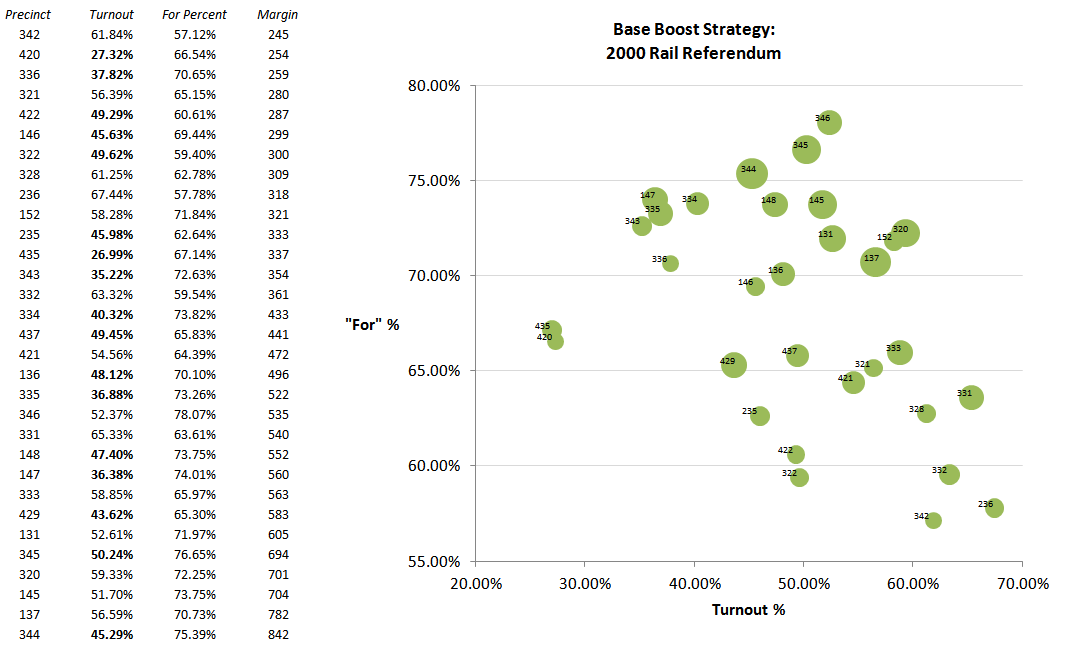
As the Robinson map shows, support for the 2000 line was concentrated in Central Austin, and quite overwhelmingly so in almost all of the precincts the proposed rail would serve. However, there were important differences in turnout and level of support that serve as the foundation of a ‘base boost’ strategy.
The top thirty supportive ‘for’ precincts are listed and plotted below. There are countless opportunities to find the missing votes through modest improvements in turnout or margin across many combinations of precincts. For example, the highest positive vote margin count actually came from a precinct with slightly below average turnout. So there are many ways to build the ‘boost’ map.
Inevitably, any conversation about boosting the base from 2000 turns to the reliability of student turnout; ‘students don’t vote’ is argued by some. But the focus on turnout rates confuses what we are really looking for, which is count of the contribution to the victory margin.
Which would you rather have of two equally-sized precincts: a precinct that has 70% turnout and a 51/49 split for your side or a district that has 45% turnout and 70/30 split for your side? The answer is the latter because of the margin. Student turnout (or any group for that matter) is less important if there is a route that engenders a lopsided margin.
The source data and my calculations for the above visualizations can be found here.
When testing the political feasibility of a rail alignment, the 2000 election seems to suggest two major obstacles: South Austin skepticism and expanding the Central base. Certainly there are other obstacles like anti-rail skeptics (i.e. Skaggs) and ideological conservatives. But those are individuals that will be opposed to rail regardless of the route. Hence it makes sense to focus on demographics and neighborhoods that can be persuaded or mobilized.
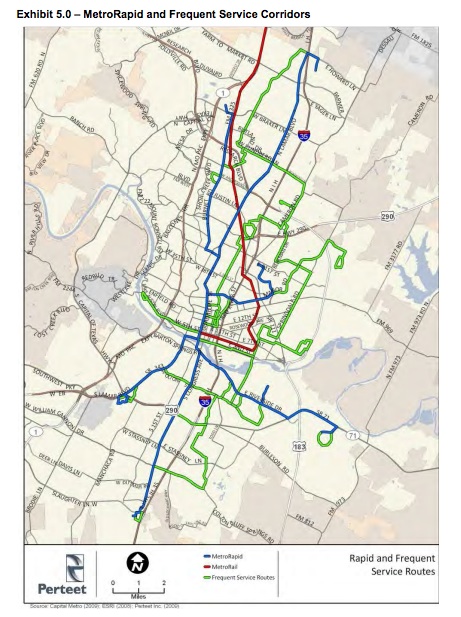
There are two major corridors presently getting a lot of attention amongst Austin transit advocates: something similar to the 2000 line focused on substituting the “1” bus line on Guadalupe-Lamar (GL) and the evolving Red Line Circulator/Mueller route. In addition, South Congress and Riverside have been floated; and obviously, it makes sense to at least explain why existing MetroRapid bus candidates corridors from the most recent CapMetro bus service plan are not the optimal initial sequence for rail. A map of them follows with the MetroRapid candidates in blue:
Among the two routes that have gotten the most attention so far, it’s possible that the circulator could maintain and potentially expand Central enthusiasm, though one wonders about the precincts that would have been directly served by the original 2000 line. But it doesn’t seem to have an answer to the South Austin issue. On the other hand, it might be able to improve performance in the Northwest corner of the Austin map if advocates tell some kind of Mopac congestion story related to the Red Line.
Advocates of GL might argue that running a better campaign that touts future expansion into the southern neighborhoods might be enough to get the line approved the second time around. They would point out that if the affordable housing bonds can be tried again after a narrow loss, it doesn't make sense to abandon a route that came so close the first time even though it faced a uniquely hostile electorate.
Others might indicate that an initial sequence of GL in the South or some other route based on existing bus service that targets South Austin might be a ridership and political winner.
Presently, there is no body of publicly-available political polls that provide a sense of how voters would react to the 'best message' for each route. And as already detailed, it’s not obvious that Mueller will achieve significant political lift relative to the GL route in the needed precincts. A South Austin focused route might solve one problem but create lower support intensity in Central Austin. The problem is compounded by the lack of detailed corridor/route comparison data.
At this time no route seems like the clear, slam dunk political winner based on available polling or electoral analysis. And if that remains the case, then other criteria such as ridership, cost effectiveness, economic impact and so on become the meaningful differentiators.
In general, Austinites should be cautious when someone argues for or against a rail route on political feasibility grounds but is unwilling to provide data to back up their assertions. The experiences and theories of professional political and public affairs consultants should definitely be taken seriously, but need to be verified with independent, open data. Otherwise, we are handing over veto power of Austin’s transit future to rather opaquely-derived intuitions based on polls or electoral data analysis that are not submitted to public review.


