CATS & DOGS
The Austin City Council is poised to make a decision on urban rail’s route based on incomplete data. At the heart of this predicament is a 2010 document entitled the “Central Austin Transit Study” (CATS). This document makes a set of fundamental assumptions about transit politics born out of the defeat of the 2000 rail referendum. Much has changed in the last thirteen years and even more will change by the best-case-scenario-ribbon-cutting for rail in 2021. Council needs a new, richer set of data to make the best decision for their Austin constituents.
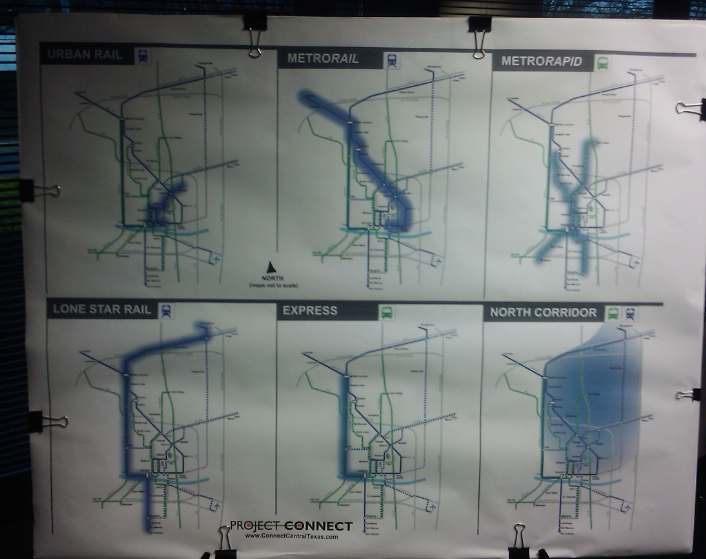
CATS focuses on evaluating the stops on a route (‘alignment’ in transit jargon) and the vehicle type (‘mode’) for thirteen connections in a pre-determined area that includes the University of Texas, the Mueller redevelopment area, the Central Business District, the Capitol Complex, East Riverside, and Bergstrom airport. The thirteen connections are visualized in the image below; darker color indicates the CATS recommended route.
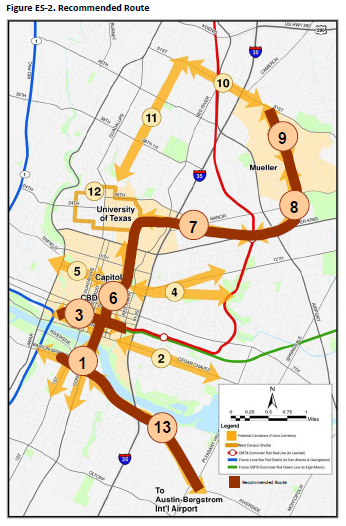
CATS does not explain why this is the optimal initial sequence for urban rail (the vehicle technology it finds most attractive). It certainly demonstrates positive benefits, but there are no comparisons with alternative routes outside of the thirteen connections.
The study provides two ridership estimates with the highest being 27,600. I could not find source code implementing the algorithm or the weights of factors described in the report narrative or the data file used. CATS does reference past studies and their associated public feedback process and calls the 2006 "Future Connections" study the ‘source study’ for its rail alternatives evaluation.
So, perhaps the "Future Connections" study (FCS) explains why the CATS recommended alignment is optimal? No, it does not. Instead – just like its child – FCS focuses on a constrained area and is fairly direct about its view of Central Austin transit as intended to ‘support the planned Capital MetroRail system and serve major destinations in Central Austin not directly connected to the rail system.’ Right below that statement in FCS is a map of the study’s focus area and a few pages later there is a list of twelve familiar-looking connections the study evaluates.
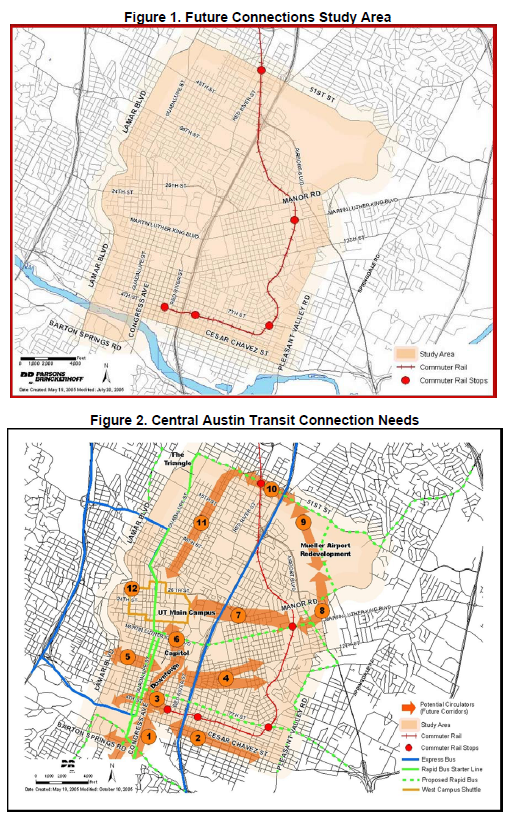
FCS goes and scores the narrow set of connections according to multi-criteria rubric (ridership, land use, cost, etc.) to craft the best route for MetroRail-supporting circulator. You can notice bands of green delineating suggested routes for rapid buses - large, technology enhanced buses that can communicate with signals. Finally, it is important to note that FCS scores a streetcar vehicle technology ahead of buses. It did not evaluate urban rail.
At this point, we are still wondering why a circulator supporting suburban commuters is the optimal first sequence for urban rail in the Austin we anticipate for 2021. We know that streetcars and urban rail are better than bus and that a circulator supporting the Red line has some ridership benefits, but we don’t know why it is the best choice. Better is not the same as optimal. And why are high ridership routes being served by the rapid bus technology? To figure this out, we have to consult the 2004 plan that spawned FCS: the "All Systems Go! Long Range Transit Plan" (ASG).
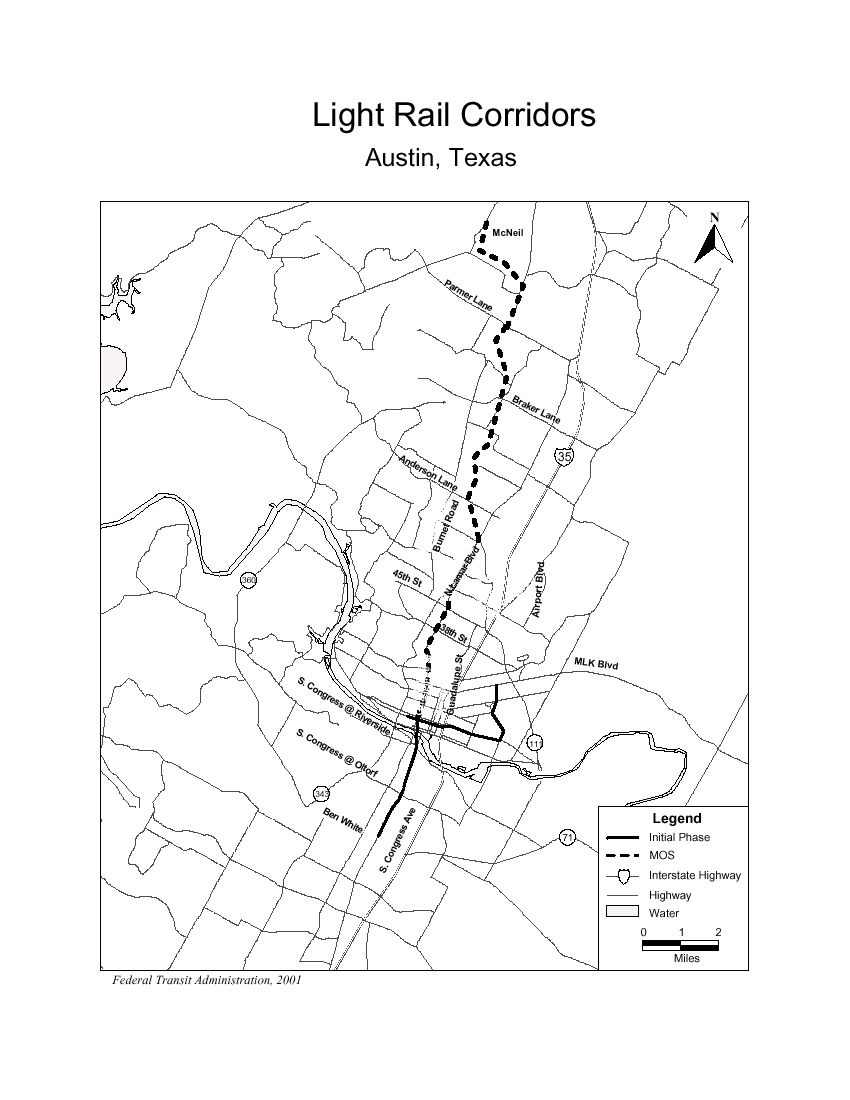
ASG was the first major public input process and study undertaken by CapMetro after the failed 2000 urban light rail referendum. The 2000 referendum proposal submitted to the Federal Transportation Authority featured a 20-mile light rail transit system with 26 stations running north-south from McNeil Road to Ben White Boulevard, and east-west from the central business district to 5th and Pleasant Valley. It estimated a ridership of approximately 37,400 weekday boarding by 2025. I was not able to gain access to a document detailing the methodology for those projections or the source file for their calculation. The proposal's route can be found in the image below.
 ASG replaced the failed referendum route with rapid bus. The remaining ASG documents do not provide a data-driven reason for this substitution. Instead, the document justifies its direction by noting the thousands of individuals that provided public input.
Obviously, the outcome of the referendum weighted on the minds of the facilitators and participants of ASG, which was used to advocate for the successful Red Line referendum. Thirteen years later, it appears our transit policy is still being driven by the child and grandchild of ASG.
When I walked into a Project Connect open house I was expecting fresh data-driven comparisons that yielded optimal recommendations. Instead, I was just offered recommendations based on CATS and its ancestors. And no data or model, just visuals. An example chart from the open house follows.
I didn’t feel empowered to make a decision on whether these recommendation were best. One could complain if there was an instinctive feeling that something was absolutely terrible and awful. But without comparison data, how would an empiricist like myself even know that?
It turns out that the influential members of Capital Area Metropolitan Planning Organization’s Transit Working Group (TWG) also were curious about the suburban commuter circulator route recommended by Project Connect. Nowadays, the alignment is typically referenced by the much warmer feeling-inducing moniker of ‘the Mueller route’.
In addressing their concerns of why a high ridership corridor like Guadalupe/Lamar was not selected, the City of Austin's Transportation Director made two arguments: (1) that the Hyde Park to UT route was not highly-scored within the CATS study and that (2) there was already a federally-funded rapid bus in the corridor. The relevant part starts at 7:59 in this video.
The Hyde Park to UT argument is tangential. The Director was referencing a potential connection in the CATS circulator as it was scored by the subjective formula of the study – it has little to do with overall ridership of Guadalupe/Lamar. And the implicit argument that there is not enough value is directly contradicted by his second point, which is that the route is so valuable that it is where rapid bus is being deployed to first (!).
While his argument might be compelling if Austin was deploying urban rail in the same corridor a year or two after the 2014 start of rapid bus, the Director pointed out at the May 11th 2012 TWG meeting that a ribbon-cutting for rail is at best six years away if we get funding from FTA immediately and the project progresses quickly. By then, the rapid buses would have logged countless miles; and in any event, they could be re-purposed to a different corridor. Finally, the local cost of the rapid buses is $9 million. Is it worth it to pick a potentially sub-optimal urban rail route costing hundreds of millions of dollars because of such a relatively small investment?
Just to reiterate the obvious: there was no defense of the Project Connect recommendation on the basis of recent ridership comparisons, just assertions about ‘optics’ that FTA might not ‘like’. Other Mueller route supporters will similarly offer justifications based on ‘development impact’ or likelihood of Tax Increment Financing – but they are not backed by detailed or comparative data. It's definitely possible that Mueller is the optimal first sequence, but the comparative evidence is not in the public domain.
One piece of data we know with certainty is who funds transit in our region. While CapMetro has a regional focus, it is funded by the sales taxes and bus fares paid in Austin. Sales taxes in the CapMetro’s service area are its primary source of revenue according to CapMetro's 2013 budget.
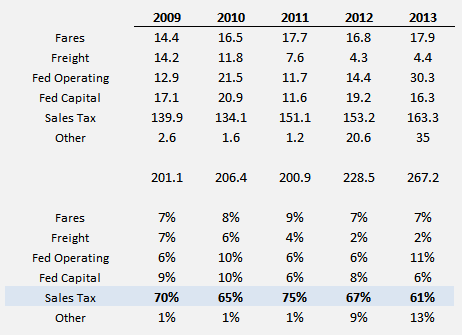
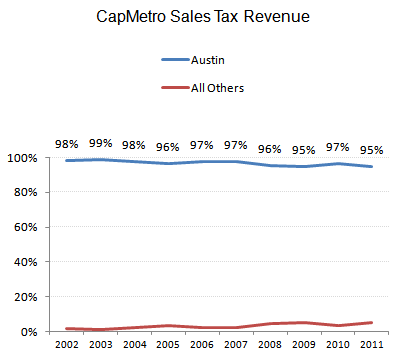
And of that revenue, almost all of it is generated by sales taxes emanating from Austin. Certainly, some residents of Leander buy their lunch in Austin and so on. But there’s no way to argue that population centers outside of the Austin city limits are meaningful financial contributors. Austinites pick up the tab for the externalities of suburbanites choosing to live far, far away from their places of employment to get additional residential square footage. The data below is from the CapMetro Comprehensive Annual Financial Report for FY 2011.
The clarity of who pays for transit juxtaposed with the incomplete set of data about the optimal initial urban rail sequence should catalyze action by Council to seek out richer data on alternative rail routes that addresses the weaknesses in how the narrowly-tailored CATS is being used as the justification for Mueller as the initial urban rail sequence. CATS is about the best allocation given the connections available to a central circulator - it is not justification for Mueller as the first urban rail project. In the spirit of keeping things weird, the Council could call the new analysis the Deciding Optimal aligGment Study. I certainly hope the data is both loud and has some bite.
It’s not just some egghead blogger pointing this out. Two externally-powered reviews of our urban rail organizing also concluded that a more transparent process with better data is needed. The hot-of-the-presses Urban Land Institute Rose Fellowship report indicated that we should urge the public input process to: “Show your work. Reinforce unprecedented openness and transparency.” Additionally, this January’s APTA peer review observed that: “The Project Connect and Urban Rail project plans are lacking complete information regarding projected ridership. Ridership projections are particularly important for the further development of Urban Rail.”
If you are interested in helping bring about a transparent and data-driven decision on the urban rail route, then you might want to check out Austinites for Urban Rail Action (AURA), a new group formed by a small band of committed Austin citizens.