Trophy, Hammer, Lottery, Transit
The proposed urban rail route’s operational costs are too high. This will undermine the overall transit system by slowing down frequency increases for productive bus routes; it could potentially also lead to outright future cuts to system coverage. The likelihood that there could be an improvement in the outlook for urban rail operating costs is small.
Project Connect does not release at assessing the system impact of the rail proposal’s operating costs. Specifically, I focused on quick ‘reality checks’ to determine the relative value of Grove-Highland rail (GHR) versus regular bus and Bus Rapid Transit (BRT.html).
A big part of the problem is the apples-to-oranges nature of what Project Connect has made available. Some estimates are for the present day and others are 16 years in the future; it’s unclear if units being referenced are the same across different documents. Below, I try and resolve this and create something closer to a tangerines-to-oranges comparison.
GHR rail is not cost-effective relative to bus due to selection of a low-ridership route.
To evaluate the productivity of the proposed rail investment, we first need to understand the existing subsidies for the bus routes it would replace. This is how we compute something akin to a mobility return-on-investment.
Sadly, Capital Metro does not provide an on-going report with this data. To overcome this, I examined the distribution of revenue hours by bus route from the 2010 Service2020 plan. Imperfect, but the best I can do with public documents. Here's my methodology: I assume that the 2014 distribution of boardings per revenue hour remains the same amongst bus routes. I divide the total 2014 costs of ridership ($4 per bus boarding) across the revenue hours. I assume that all buses have similar average fare-per-boarding ($0.40 for an overall 10% farebox recovery rate for bus, which is the 2014 average).
As a result, the 7 and 20 routes GHR replaces have a combined 2014 per boarding subsidy of $2.21. You can check the computations by examining this Excel file.
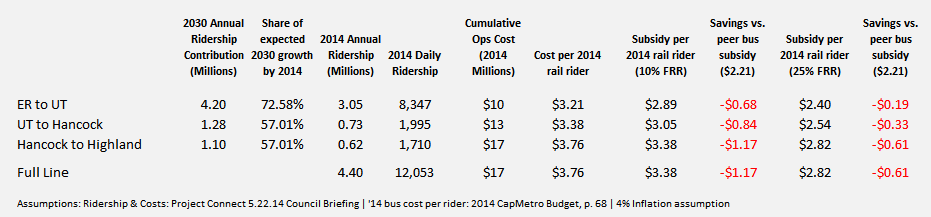
The chart above discounts Project Connect's asserted 2030 annual ridership to the present day based on their growth projections for the Highland and East Riverside ‘sub-corridors’. I also discount Project Connect's 2022 assertions about rail operational costs at the 4% rate they've used as an inflation assumption in public discussions. Those costs are then allocated to my estimated 2014 ridership numbers for rail. This helps us consider the route's productivity if it magically appeared tomorrow.
Even though the Mayor's rail advisory group selected a route, we don't know the actual fare level. Recently, Project Connect has indicated that the fare might resemble a “premium” amount. This might help with farebox recovery, though it certainly puts additional pressure on the ridership estimates given the price-sensitivity of our riders. A recent high profile example of our riders' price-sensitivity: the sluggish boardings numbers from the MetroRapid rollout. In any event, I calculate both a conventional CapMetro bus farebox recovery rate (10%) and a national light rail benchmark farebox recovery rate (25%). Under either scenario, GHR creates a relative operational deficit. It's an annual $5.1 million loss with the former farebox recovery rate (FRR), $2.7 million with the latter FRR. The current bus operations budget is $110 million.
Here’s an Excel file with the calculations for the above chart.
But wait, this isn't that bad. How could one think this could be 'Red Line' bad?
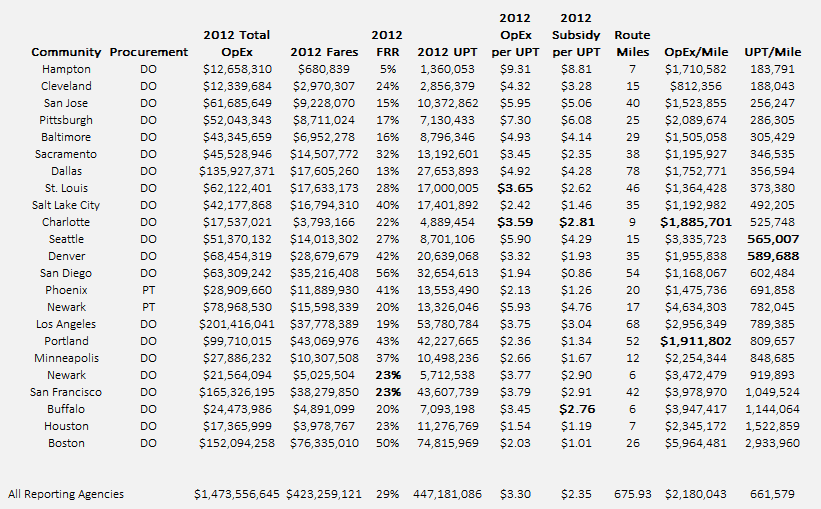 Source: National Transit Database. "UPT" means unlinked passenger trip (i.e. boarding). Median values for a category in bold.

It's certainly possible that the $5-3 million gap could be covered by a contribution from the University of Texas, or some special federal grant, or a quirky transit financing scheme. But to understand how this proposal could quickly become a big speed bump to high-frequency bus service - the Red Line has an annual operating subsidy of $11 million - we simply have to adjust some of the Project Connect assumptions to realistic benchmarks.
Benchmarks are based on the table above, which was computed using data from the National Transit Database. Here's the source data and computations in an Excel file.
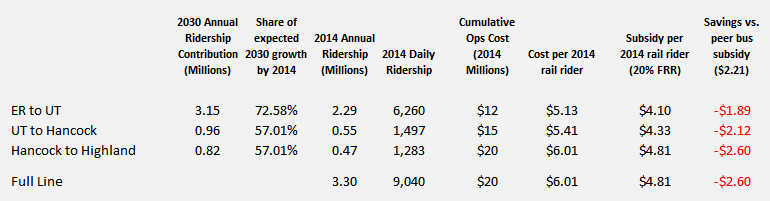
For starters, today's 7/20/100 bus routes combine for 13,000 boardings and that covers much more than GHR. Let's discount the ridership 25% to get to a more realistic boardings number, especially given the "premium" fare. Second, let's make the operational costs match the Houston and Charlotte (Southern labor costs, low miles) peer systems at $2m per mile. Finally, let's use a 20% FRR based on comparable non-coastal cities (Houston, Dallas, Charlotte). With these changes, GHR opens up an $8.6 deficit relative to conventional bus.
But wait, won’t anticipated growth fix these issues?
There is a certain political genius of Project Connect releasing 2013 operating cost assertions (lowest point ever) with 2030 ridership assertions (higher point than today!). The temporal mismatch makes it seem as if the proposal might be cost-competitive. Proponents typically pangloss over the fiscal short-comings of the proposal by appealing to the healing power of anticipated future growth.
But that optimism isn't justified by the facts. Core GHR ridership is East Riverside to UT (70% of asserted ridership). Per Project Connect assertions, that area will grow at a slower rate than the areas north of UT. For the sake of argument, let’s add all of the asserted 2030 growth in areas north of UT to my calculation of 2014 GHR East Riverside-to-UT ridership total. That’s 5.43 million annual boardings estimated for 2014 GHR.
Hence, the per-passenger cost is $3.13 given the 2014 $17 million in operating costs. This, incredibly, would require a 30% FRR to match 2014 peer bus costs. Even if the unrealistic growth towards Highland comes to fruition, its starting point is so low that it can't really save that segment. Worse, the route points towards northern suburbs and the airport, neither of which promises the housing and residential density needed to improve productivity.
The core problem is the selection of a low density route; unlike Houston, which built track targeting a high rate of boardings per mile, we've selected a route that will be middle-of-the-pack at 685,000 boardings per mile. And that is only achieved eight years into the operation of the line if growth meets the Project Connect estimate.
The second problem with the growth-ex-machina argument is that it doesn’t examine the marginal improvement in ridership compared to BRT or regular bus. Yes, the 18,000 2030 Project Connect boardings assertion is higher than the current 13,000 boardings for the the entire 7/20/100 coverage. But of those 18,000, how many would conventional bus service at higher frequency capture in 2030? Remember, the BRT estimate is 17,000; it’s quite possible that high frequency, regular bus service would capture maybe 15,000 of those riders in 2030.
Project Connect has not released any data modeling this central question; it's unclear if it was even considered since it did not come up at the Mayor's rail advisory group.
Given these analytical blindspots, GHR seems like a very expensive purchase of substantial excess capacity. And this excess capacity is for a route where transit needs can be met with cheaper, more flexible tools (i.e. conventional bus, BRT). Why spend hundreds of millions to serve essentially the same number of people, with a more expensive technology?
Rail is a type of transit technology with high fixed costs and low variable costs. Rail is for transit at scale.
GHR is often defended as a political trophy (“A world-class city has rail”), or as a hammer (“This will force the NIMBY crowd to accept growth in the core”), or a lottery ticket (“Let’s see if we can shape the growth”). Discussion of GHR should focus on rigorous analysis of its cost-effectiveness as a mobility tool given the actual development realities on its route.